Technical violations, immigration detainers, and other bad reasons to keep people in jail
How ICE and probation and parole detainers (or “holds”) contribute to unnecessary jailing
by Wendy Sawyer, Alexi Jones and Maddy Troilo, March 18, 2020
By now, most people paying attention to the U.S. criminal justice system have heard about problems with the overuse and misuse of local jails. Chief among these problems are the serious, even deadly, harms caused by even brief periods of jail detention. But one problem has escaped the attention of the public and policymakers alike: the unnecessary jail detention caused by “detainers,” which account for as much as one-third of some jail populations, if not more. This briefing explains how detainers (also often called “holds”) contribute to unnecessary jailing, and offers a preliminary analysis of available national, state, and local data as evidence of a widespread policy problem that demands greater attention.
Detainers, explained
Typically, people in jails are categorized as unconvicted (65% nationally) or convicted (35%). In our Mass Incarceration: The Whole Pie report, we have been able to go one step further, breaking apart the roughly 16% who are held for other agencies that pay to keep them boarded there. But another group of people are still obscured by this breakdown of the jail population: people who are in jail for more than one reason, who have what we’ll call a “dual status.” A significant number of people are locked up because of some kind of “detainer” or “hold” for their probation or immigration status, for example, which renders them ineligible for release. These people aren’t brought into jail on a detainer, but the detainer can keep them there when they otherwise could have gone home.
For example, if someone who is on probation is charged with a new low-level offense, they can be held in jail without bail if the probation department has issued a detainer for violating their probation. In fact, this is a critical part of Kalief Browder’s story: initially held on unaffordable bail, he was later denied bail because the Probation Department filed paperwork saying the new charge meant he had violated probation. It was the “violation of probation” – or “probation hold” – that kept Browder at Riker’s so long, causing irreparable harm that led to his eventual death. Without his dual status as a probationer, he probably wouldn’t have had money bail set in the first place: his friend, who was arrested along with him but was not on probation, was allowed to go home the next day. Even with his probation status, the judge was willing to set bail. It was only when the Probation Department stepped in to make their claim on his freedom that the judge remanded him without bail.
Detainers or “holds” are an overlooked policy problem that carries significant personal, social, and fiscal costs. They often expose detained people to the harms of incarceration for longer periods of time than they would be otherwise. This includes innocent people like Browder, whose case was dismissed three years into his time at Riker’s, after tremendous damage had already been done. By delaying jail releases, detainers also contribute to avoidable public costs by filling up local jails, often with people who are accused of low-level offenses. Detainers undermine the work of local jurisdictions trying to reduce unnecessary detention through pretrial reform, keeping people locked up for essentially administrative reasons rather than public safety reasons.
Detainers that impact jail populations most: Probation & parole holds and ICE detainers
As we touched upon above, probation and parole violations account for a lot of detainers. These can be for either “technical violations” or new violations of law. Technical violations are behaviors that break probation or parole rules, such as missing curfew, failing a drug test, or missing a check-in meeting; they are not behaviors that would count as “crimes” for someone not under community supervision. However, when people who are under community supervision are charged with a new crime, that also constitutes a violation of their probation or parole, and typically must be reported.1 Individuals can be kept in jail without bail for either type of violation on a probation or parole detainer.
In a 2019 report, the Council of State Governments (CSG) found that “45% of state prison admissions nationwide are due to violations of probation or parole.” Technical violations alone account for 25% of prison admissions; even less (20%) are for new criminal offenses. There is no comparable analysis for jails, but the fact that community supervision violations contribute so significantly to prison populations is suggestive that these violations could be responsible for large numbers of people locked up in jails as well.
U.S. Immigration and Customs Enforcement (ICE) also uses detainers to keep people in local jails to give ICE time to take them into federal custody for eventual deportation. These detainers, or “immigration holds,” request that local officials to notify ICE before a specific individual is released from jail custody and then to keep them there for up to 48 hours after their release date. These detainers essentially ask local law enforcement to jail people even when there are no criminal charges pending.
These detainers are the subject of heated debate, as many local jurisdictions are reluctant to take on the risk of litigation and liability associated with the constitutional concerns they raise (and/or reluctant to support the Trump administration’s immigration policy), which is reflected in the growing number of detainer refusals. Part of their reluctance may be that these risks are often taken on unnecessarily: ICE doesn’t consistently take these individuals into its own custody, even when it issues a detainer for them. The last time ICE released data on this point, the agency was only assuming custody in 35% of all cases where they issued a detainer – meaning that most of the time, jails that kept people locked up on ICE detainers did so for no reason at all.
How many people are in jail because of probation and parole detainers?
(The short answer: it varies, but in some places it’s over a third of the jail population, and we need better data to really answer this question.)
Because of various data difficulties, described below, it is currently impossible to determine exactly how many people in the U.S. are held on detainers and might otherwise have been released from jail. However, we have compiled some preliminary data from cities and counties around the country, including both rural and urban jurisdictions, to get a sense of how much detainers contribute to jail populations. We specifically focused on probation and parole detainers as we found these data were more widely available.
National data
First, in an attempt to get a sense of the problem on the national level, we looked at the data from the most recent Survey of Inmates in Local Jails (SILJ), which was conducted in 2002. That survey allows people in jails to provide details about why they are in jail, including people who are there for multiple reasons (i.e. dual statuses). Although these data are now nearly twenty years old, and are not as tidy as we’d like (again, see data problems, below), there is no other nationally representative data that provides these details. Our findings should be interpreted as historical context for jail detainers, as the share of people held on detainers nationwide has very likely changed since 2002.
Our analysis of the SILJ data finds that in 2002, 20% of the total jail population were on probation or parole at the time of their arrest, and therefore could have been held on a detainer for a violation.2 Moreover, 44% of the unconvicted population were under community supervision when they were arrested and could have been on probation or parole detainers. This second point is important since it illustrates that many people (like Browder) are held pretrial at least in part because of a probation or parole hold, and may be ineligible for release on bail even if it is set. To eliminate unnecessary pretrial detention, policymakers will need to address these holds in addition to the money bail system.
Statewide data: New York and Texas
In terms of widely representative data, statewide data is the next best thing to national. We found two states, New York and Texas, have published current statewide data on people held in jails for parole violations.3 In New York, only data on technical parole violations was available statewide; people on parole with new criminal charges are not reported separately except in New York City. Statewide, technical parole violations accounted for more than 1 in 12 people, or 8.6%, in New York jails in 2019. Troublingly, despite a 20% decrease in the total jail custody population over the past 4 years, there has been a 5% increase in the number of people held on technical parole violations. These trends are more pronounced in New York City jails than in other parts of the state; in the city, the total population is down 25%, while jailing for technical violations is up 12% since 2016.
Texas’s jail data reporting stands out from other states; it publishes detailed, statewide jail population statistics broken down by county every month. Texas’s data reports also distinguish between people detained on “blue warrants” (their term for technical parole violations) and people accused of violating parole for new charges. As of February 1, 2020, people on parole made up 8.3% of the jail population statewide. Technical parole violations accounted for just under half of this group (3.4%), while those on parole who also had a new charge made up the rest (4.6%).
Jails in large urban counties
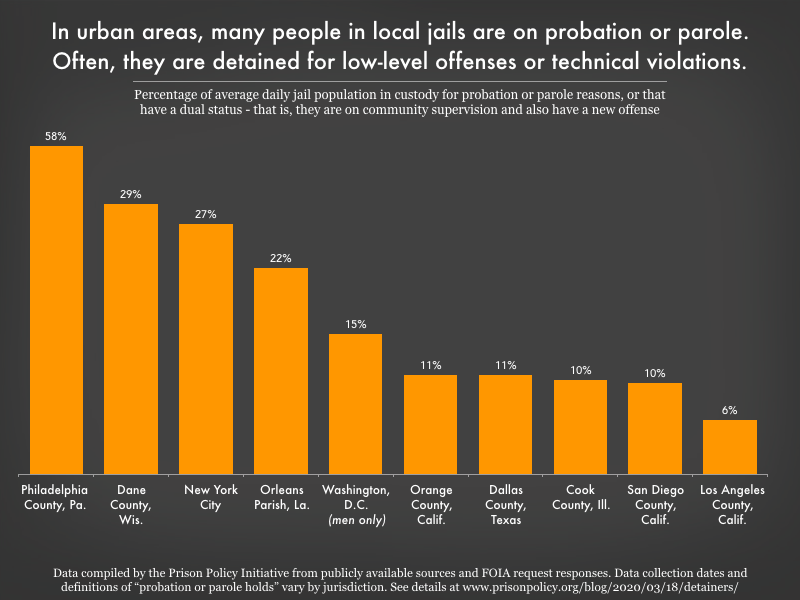
We also looked at other large urban counties that have published data on probation or parole holds. We submitted FOIA requests to the ten largest counties in the U.S., and supplemented these requests with data from other urban counties that was available online. We were able to analyze recent data from 10 urban areas, including New York City. To summarize the results (detailed in the Appendix), we found that across those 10 urban areas, the share of people held at least in part for probation or parole reasons ranged widely, from 6% to 58% of the average daily jail population.
Rural jails
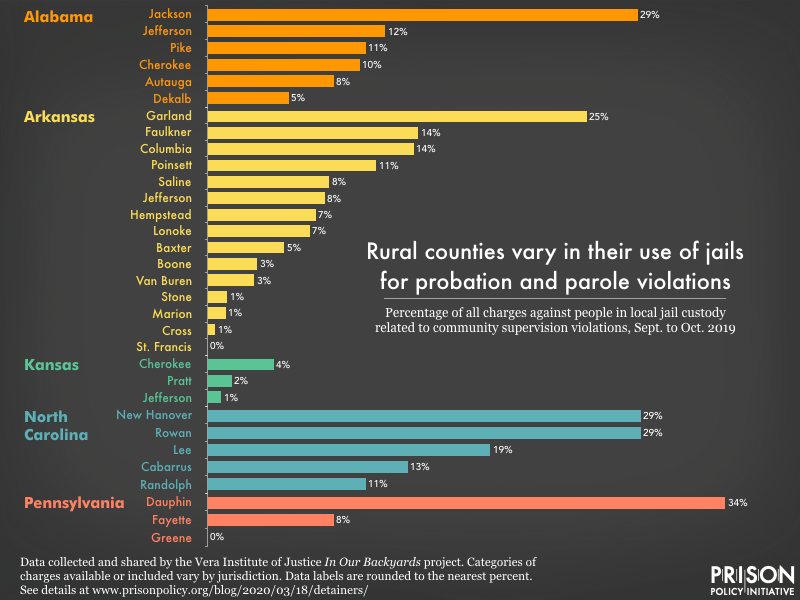
Finally, we reviewed jail population data from over 30 rural counties across 5 states to see how probation or parole violations affect rural jail populations. For this, we relied on data collected between September 18 and October 18, 2019 by the Vera Institute of Justice’s In Our Backyards project.4 The data show that in these rural counties, charges related to supervision violations account for an average of 14.6% of all charges against people held in jail. The share of probation and parole violations in jails varies widely between counties, however; two counties held no one with a supervision violation, while these violations made up more than 25% of all charges in 5 other counties’ jails. (For details, see the Appendix.
State and local policies impact how many people are jailed for supervision violations
Differences in policy and practice explain much of the variation in jailing people for probation and parole. For example, Kansas allows some people accused of violating parole to be transferred from local jails to state prisons to await their hearing establishing “probable cause” for the violation. These transfers relieve some of the strain on jails caused by parole violations, but only shift the site of incarceration and the resource burden to state facilities.
In other states, local jails are used for short, carceral punishments for probation or parole violations. In Alabama, these are called “dips”; in California, they’re called “flash incarceration.” Whatever they are called locally, these short jail stints are included in the number of people in jails for supervision violations. Of course, unlike some other probation or parole detainers, these “dips” reflect a formal policy choice of using of jails for the enforcement of probation or parole conditions. Unfortunately, it is not always possible to discern in the data how much jail detention for supervision violations is intentional punishment, and how much is an unintended consequence of administrative practices.5
Finally, local decisions about how the jail should be used affect the number of people detained for probation and parole violations. At the time of a jail population analysis in Salt Lake County, for example, supervision violations made up a shockingly low 0.4% of the jail population. But this was a direct result of the sheriff’s refusal to accept people accused of probation or parole violations at the jail.
Jail data inconsistency makes it hard to assess the scale of the problem
One problem with addressing the problem of detainers is that there is a tremendous amount of variation in how local jurisdictions treat them, both in practice and in their system’s data. This is often due to what we call the dual-status problem: is an unconvicted person with a detainer categorized as “pretrial,” a “hold,” or both? Some jurisdictions, like Philadelphia, have allowed for these dual statuses in their data infrastructure; Philadelphia can – and regularly does – analyze its jail population across 14 different categories of conviction and hold status. In others, the decision to categorize someone as “pretrial” versus a “hold” might vary, making it hard to compare these numbers across jurisdictions. Furthermore, once the new charge is resolved (i.e. dismissed or acquitted), their status might change from “pretrial” to “hold,” even if they were in custody all along because of the detainer.
Another problem comes from a lack of specificity about probation and parole detainers; the public records rarely distinguish between technical violations and new law violations. This makes it difficult to determine whether someone held for a “violation of probation” is accused of a low-level offense for which they would have been eligible for pretrial release, were it not for their probation status. Finally, the data can also become confusing where people being boarded for other agencies (such other counties, the state prison system, or the US Marshals) are also categorized or described as “holds.”
Next steps
The statistics presented here – from the 2002 national survey, the statewide data from New York and Texas, and the small sampling of urban and rural counties – are by no means representative of all jail populations in the U.S. But we offer this initial analysis as evidence of an overlooked policy problem that is contributing to unnecessary jail detention and demands more attention, from local and state policymakers, sheriffs and courts, and from reform advocates.
A crucial first step is to assess how detainers and people with dual statuses are captured and reported in local data, and to address ambiguities so that the data can meaningfully inform decisions about when and why people are jailed. Local jurisdictions that find they are using their jails to detain people unnecessarily – for immigration reasons, for technical violations of supervision, or for low-level offenses because of a dual status – should develop non-carceral alternatives (and, in the case of ICE detainers, simply refuse them). Meanwhile, counties holding people on detainers should establish an efficient “‘holds’ resolution process” with the sheriff’s staff, probation and parole offices, and the county prosecutor’s office, to minimize the burden on local resources as well as the harms of unnecessarily jail detention.
Acknowledgements
Special thanks to the Community Justice Exchange for helpful early conversations, to the Vera Institute of Justice In Our Backyards project for sharing rural jail population data, to Roxanne Daniel for additional research support, and to David Bennett for directing us to additional sources and providing valuable insights.
Appendix
| Jurisdiction | Probation or parole holds as percentage of jail average daily population | Data notes and collection dates | Sources |
|---|---|---|---|
| Los Angeles County, Calif. | 5.8% | Average number of people in 2018 who were in custody for violating their probation or parole | Los Angeles County Sheriff’s Department, Custody Division Population Year End Review 2018 |
| Philadelphia County, Pa. | 58% (all categories), 10.5% had detainers but no open cases | Snapshot data from January 31, 2020. In the more inclusive analysis (the 58%), we included the following categories: 1. Philadelphia Detainers – No Open Cases, 2. Other holds/Detainers – No Open Cases, 3. Philadelphia + Other Holds/Detainers – No Open Cases, 4. Philadelphia Detainers Only + Open Cases, 5. Other Holds/Detainers Only + Open Cases, 6. Philadelphia + Other Holds/Detainers + Open Cases, and 7. Other. | First Judicial District of Pennsylvania Department of Research and Development, Philadelphia jail population detailed snapshot report, January 2020 |
| Dane County, Wis. | 28.8% | Snapshot data from April 25, 2019 | JFA Institute, Analysis of the Dane County Jail Population |
| Orleans Parish, La. | 22% | Snapshot data from March 2, 2016 | Vera Institute of Justice, New Orleans: Who’s in jail and Why? First Quarterly Report January-March 2016 |
| Washington, D.C. | 12.6% of women, and 14.9% of men | Snapshot data from October 2019 | DC Department of Corrections Facts and Figures October 2019 |
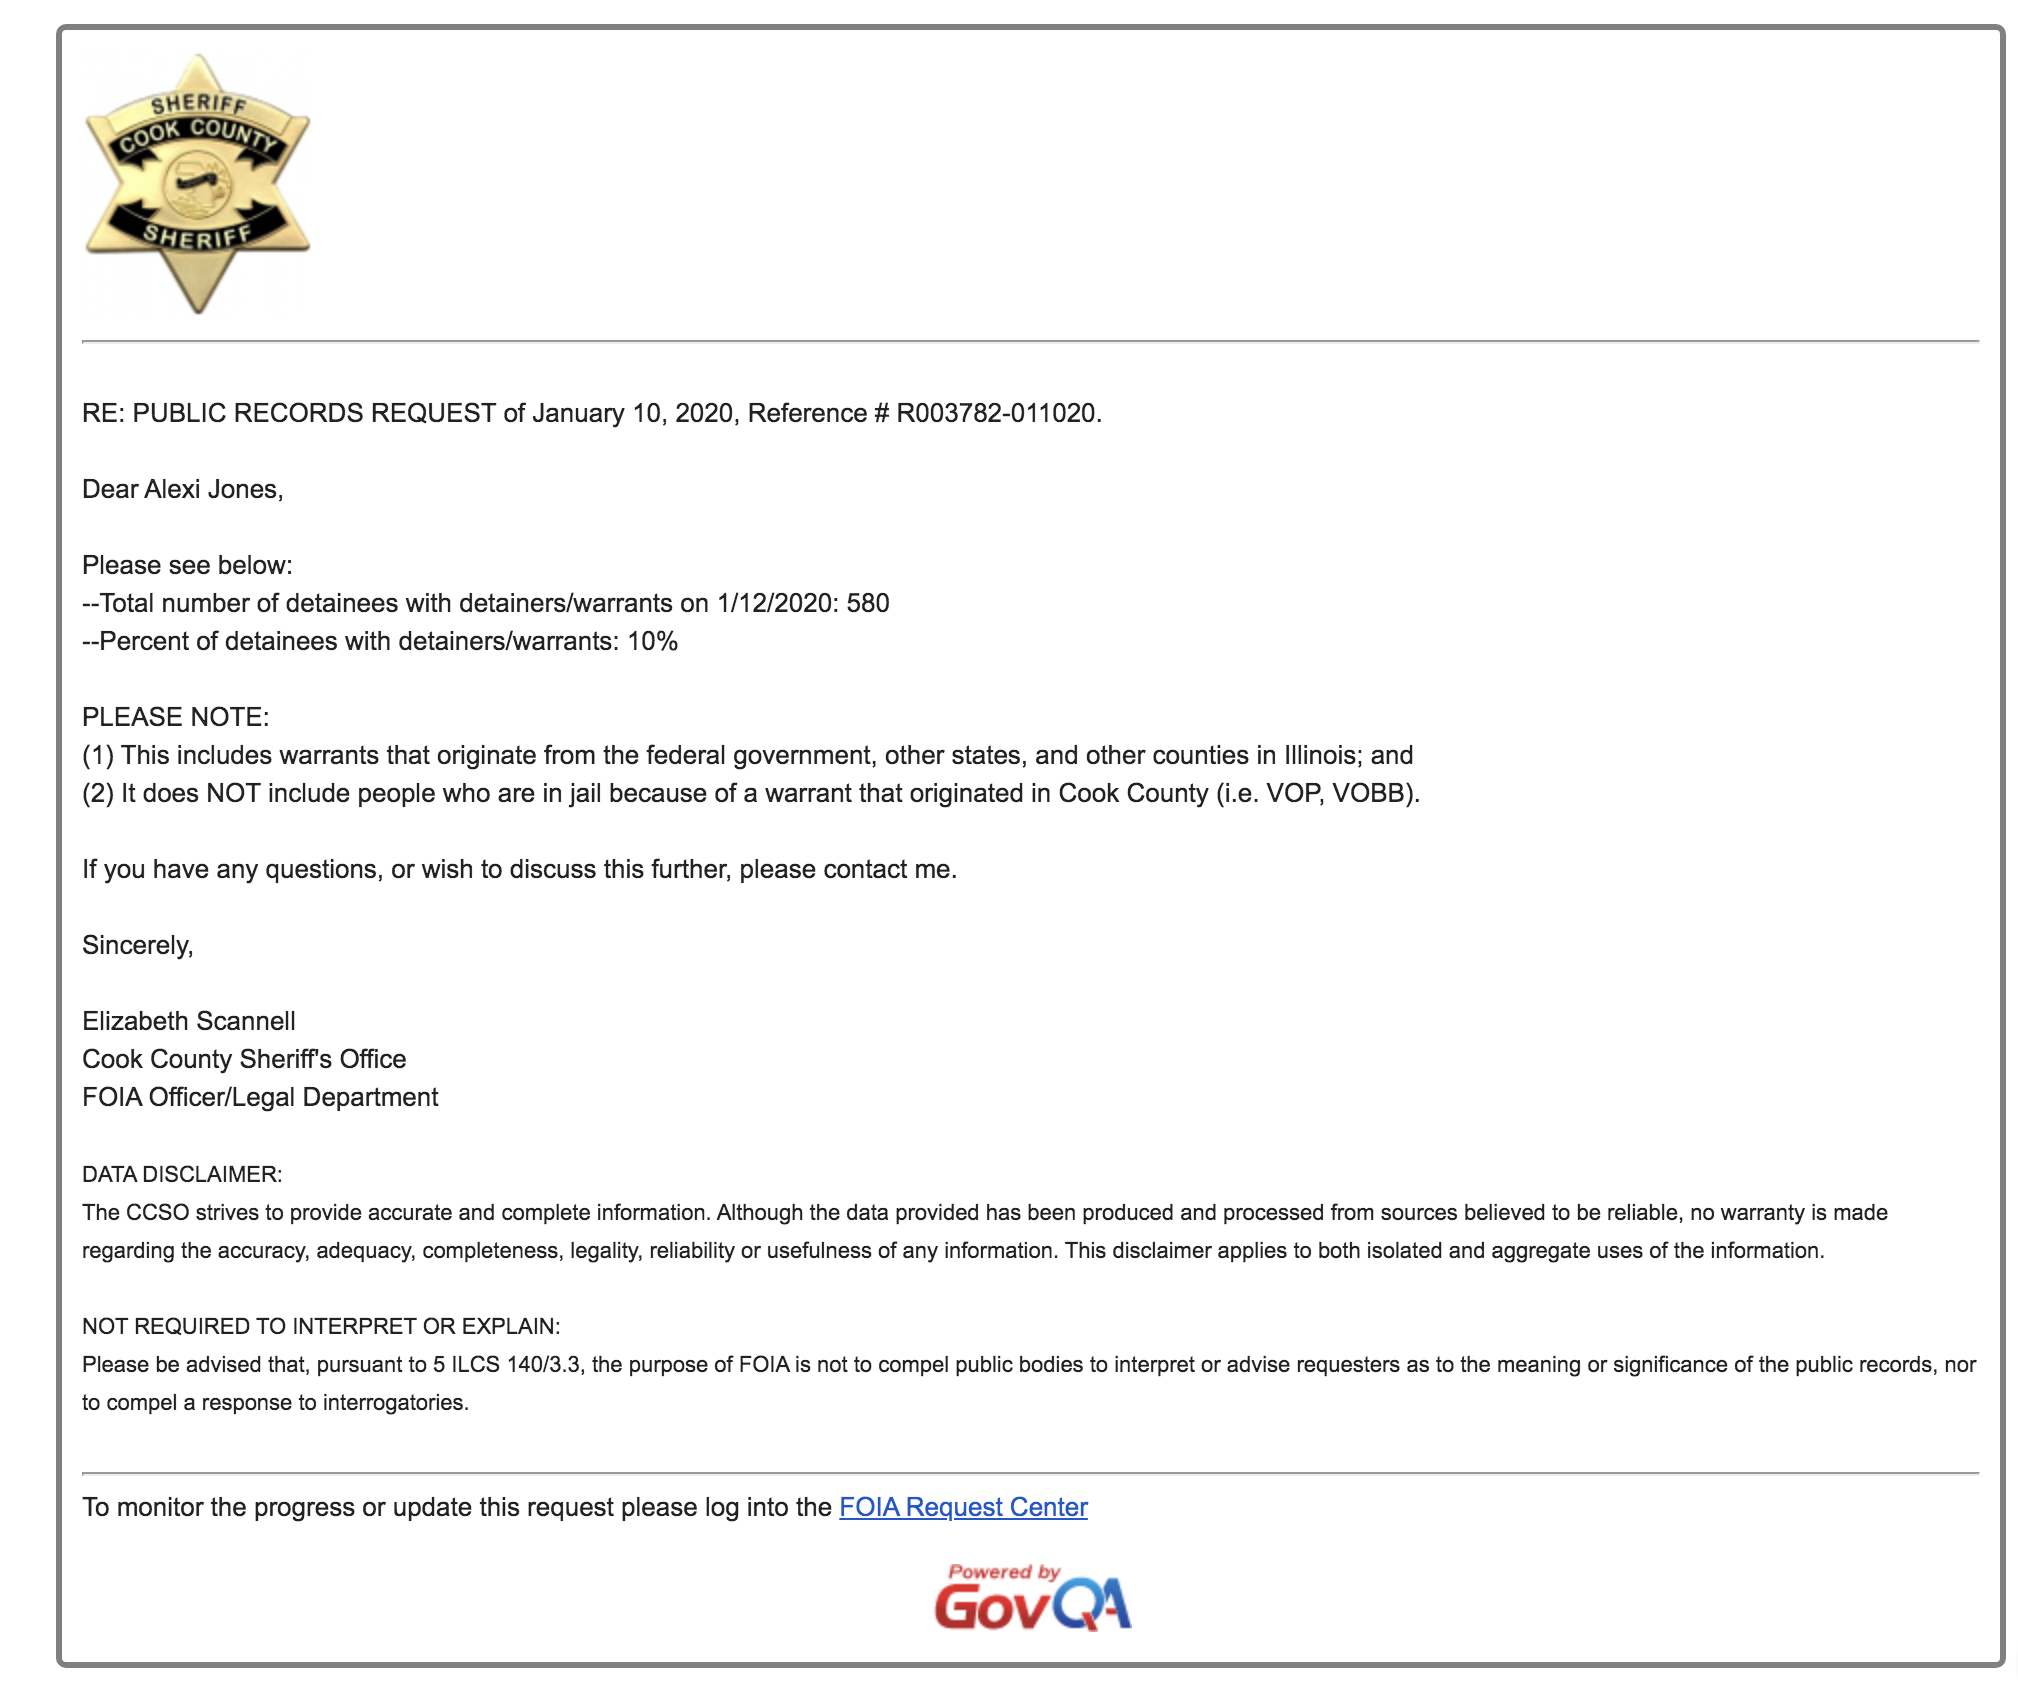
| Cook County, Ill. | 10% | Snapshot data from January 12, 2020 | Cook County Sheriff’s office, Public Records Request response |
| Orange County, Calif. | 10.6% | Snapshot data from January 14, 2020. The percentage is based on the February 27, 2020 total custody population of 5,179, provided by the sheriff’s office over the telephone. The call confirmed that this fell within the usual range for the average daily population, which over the previous 6 months was between 5,000 and 5,200. | Orange County Sheriff’s office, Public Records Request responses (available upon request with identifying information redacted) |
| Dallas County, Texas | 10.6% | Average for the month of January 2020 | Dallas County Criminal Justice Management Committee Information Statistics Public Records Request response |
| San Diego County, Calif. | 9.75% | Snapshot data from February 14, 2020. This includes a total of 527 people in custody for supervision-related reasons, including: 149 people in custody “with open charges/arrests associated with being in violation of parole” and 378 people in custody “due to Assembly Bill 109 (2011) and Criminal Justice Realignment or who were brought into custody due to a probation violation of some sort. Specifically, there were 210 inmates with revocations per Penal Code 3455, and 87 inmates with flash incarcerations per Penal Code 3453. Additionally, there were 81 people that had arrests for Penal Code 1203.2(A). This is not necessarily a “hold” but requires the inmate to attend court.” The percentage is based on the Feb. 27, 2020 total custody population of 5,405. | San Diego County Sheriff’s Department, Public Records Request response |
| New York City, N.Y. | 27% | Snapshot data from March 16, 2020. 807 (14.8%) people in New York City jails had an “Inmate status code” of DEP (Detainee – with Open Case and VP Warrant); 652 (11.9%) were coded as DPV (Detainee – Technical Parole Violator), out of a total custody population of 5,471. | NYC OpenData, Daily Inmates In Custody (as of March 16, 2020). For annual data, see New York State Jail Population 10 Year Trends: 2010-2019, page 3 |
| Salt Lake County, Utah | 0.4% | April-June, 2007 | Salt Lake County Criminal and Social Justice Master Plan, Chapter Two: Jail Population Breakdown |
Table 2: Community Supervision violation charges in rural jails
| Jurisdiction | State | Charges related to supervision violations as a percentage of all charges against people in jail custody |
|---|---|---|
| Autauga County | Ala. | 8.4% |
| Cherokee County | Ala. | 10.1% |
| DeKalb County | Ala. | 5.4% |
| Jackson County | Ala. | 28.6% |
| Jefferson County | Ala. | 11.8% |
| Pike County | Ala. | 10.5% |
| Baxter County | Ark. | 5.1% |
| Boone County | Ark. | 3.3% |
| Columbia County | Ark. | 13.7% |
| Cross County | Ark. | 0.5% |
| Faulkner County | Ark. | 14% |
| Garland County | Ark. | 25.2% |
| Hempstead County | Ark. | 7.2% |
| Jefferson County | Ark. | 7.8% |
| Lonoke County | Ark. | 6.8% |
| Marion County | Ark. | 1.2% |
| Poinsett County | Ark. | 11.2% |
| Saline County | Ark. | 8.1% |
| St. Francis County | Ark. | 0% |
| Stone County | Ark. | 1.3% |
| Van Buren County | Ark. | 3.1% |
| Cherokee County | Kan. | 4.4% |
| Jefferson County | Kan. | 0.9% |
| Pratt County | Kan. | 1.6% |
| Cabarrus County | N.C. | 13.3% |
| Lee County | N.C. | 18.8% |
| New Hanover County | N.C. | 28.8% |
| Randolph County | N.C. | 10.5% |
| Rowan County | N.C. | 28.8% |
| Dauphin County | Pa. | 34.4% |
| Fayette County | Pa. | 8.4% |
| Greene County | Pa. | 0% |
Footnotes
- Probation and parole officers typically have more discretion over how to respond to technical violations, which, by themselves, often do not result in arrest or detainer. ↩
- To be clear, the survey does not ask respondents whether they were held on a detainer, so those 20% of jail detainees represent the maximum number that might have been held on probation or parole detainers, assuming all respondents on probation or parole reported their status accurately. ↩
- We did send FOIA requests to states we thought were likely to collect this data at the state level. Three states (Wisconsin, South Dakota, and Colorado) did respond, but the data they provided was not compatible with that of New York and Texas. These states provided the annual number of holds and/or the annual “days” of holds (with each day a person with a hold is in jail counting as a “day”), but not point-in-time snapshot data that would allow us to calculate the percentage of holds in the total daily population on a given day. ↩
- Because of how they are collected, these data reflect the number of charges for supervision violations, not the number of individuals held for those violations; despite using a different unit of measurement, the data still offer a view of how much probation and parole violations contribute to jailing generally. ↩
- San Diego County, Calif., provided a breakdown of its probation and parole “holds,” noting that “[t]he definition of a ‘hold’ may be interpreted in many different ways.” On February 14, 2020, there were 149 people in custody with open charges/arrests associated with being in violation of parole. Another 210 people had probation or parole revocations, and 87 people had “flash incarcerations.” According to the FOIA response, an additional 81 people “had arrests for Penal Code 1203.2(A). This is not necessarily a ‘hold,’ but requires the inmate to attend court.” ↩


